I recently built a portfolio project in Tableau with a premise I enjoyed: I played the role of a data analyst for the Boston Celtics, and the job was to answer the kinds of questions a front office actually asks. Not "make a bar chart," but "how did we survive last season" and "where do we find more playmaking." I pulled fresh 2025-26 data, built the model, and let four questions drive the whole analysis.
This is a portfolio piece from my transition into data analytics, built to show the full path from raw data to stakeholder answers.
The full interactive workbook is embedded at the end of this page, or you can open it on Tableau Public ↗. All numbers are regular season.
The data, and the cleaning that came first
Everything comes from Basketball-Reference (Sports Reference LLC): 2025-26 regular season player totals, playoff totals, league standings, and the Celtics game-by-game log, cleaned into four CSVs and connected in Tableau with relationships. I validated the results against the official Celtics statistics page and every figure reconciled to the decimal, for example Jaylen Brown at 28.7 points per game (2,038 points over 71 games).
The cleaning taught me as much as the charts. Traded players appear on multiple rows: one per team plus a combined row labeled 2TM, 3TM, or even 4TM. Sum points naively and every traded player counts twice. James Harden shows a combined row with 557 assists plus separate rows for his Clippers and Cavaliers stints. I handled it with two calculated fields, including my first level-of-detail expression: a Season Row filter that keeps the combined row for traded players and the only row for everyone else. I also caught a quirk worth knowing: traded players can carry different positions on different rows (CJ McCollum was a shooting guard in Washington and a point guard in Atlanta), which the combined row resolves. Five players had that conflict, and I only knew because I checked.
Question 1 · From the coaching staff"Which positions shoot the three well, for us and around the league?"
My first answer was wrong, and that mistake became the most valuable part of the project. I built a table of average 3-point percentage by team and position, and it told me Lakers centers shot a perfect 1.000 from three.
AVG treats every player equally: a 1-for-1 shooter counts the same as a player with 500 attempts. The honest number is total makes divided by total attempts, which weights by volume:
SUM([3P]) / SUM([3PA])
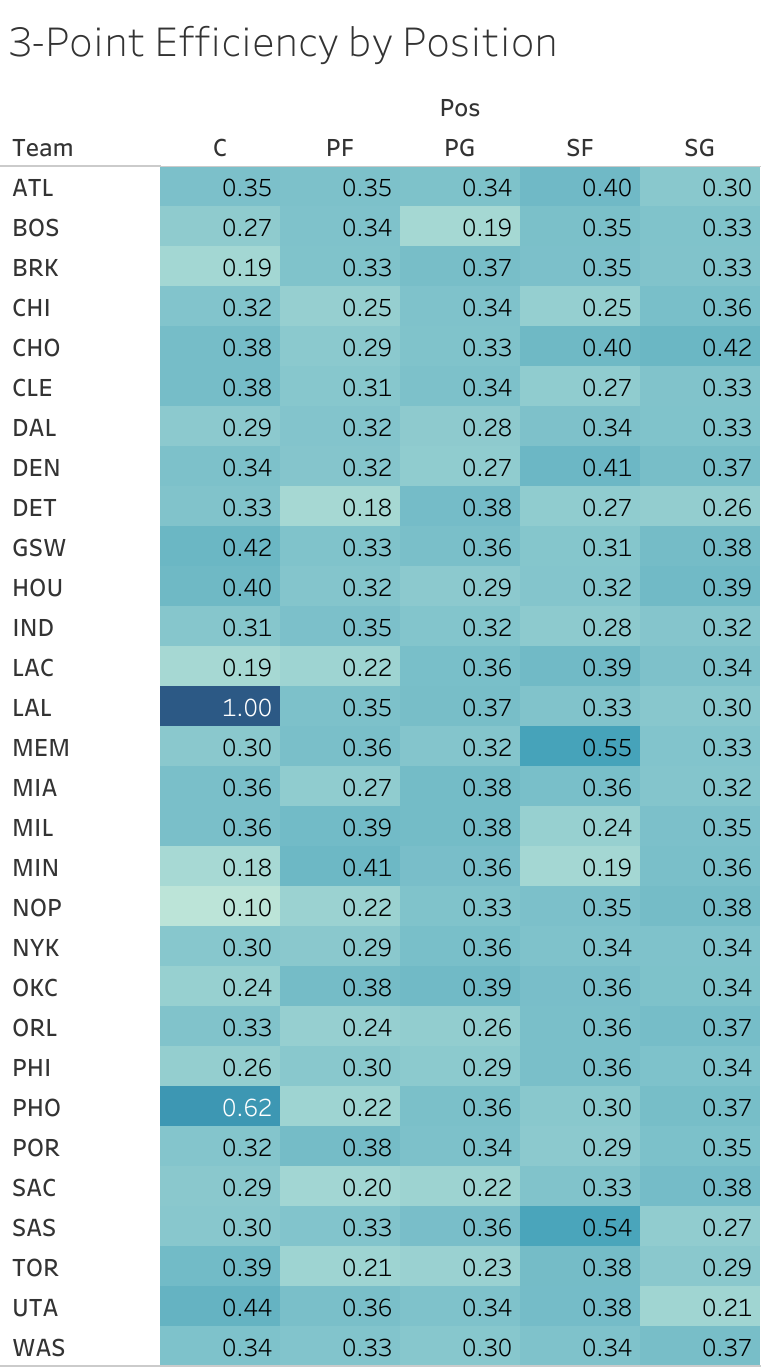
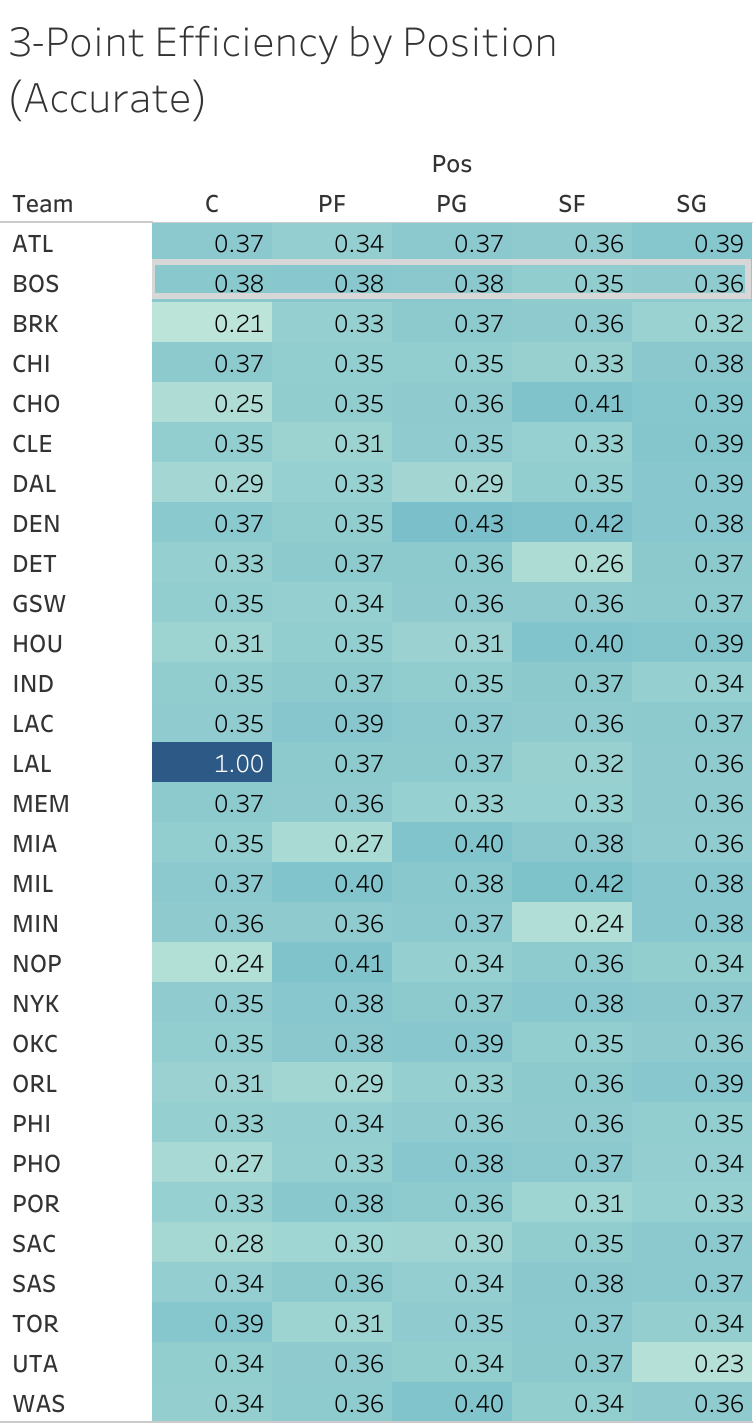
Most extreme cells corrected themselves. Phoenix centers dropped from .62 to .27 once Mark Williams' single made three stopped outvoting Khaman Maluach's 21 attempts. But the Lakers cell stayed at 1.000: Jaxson Hayes went 3-for-3 and no other Lakers center attempted a single three all season. The number is arithmetically perfect and still needs a human next to it saying "based on three attempts." I added attempt volume to the tooltip so the table documents its own reliability.
And the answer for the coaching staff: Boston does not have a shooting weakness to fix by position. Every Celtics position shot between .35 and .38, the flattest profile in the league. Most teams concentrate their shooting in one or two spots, like Denver's point guards at .43. Boston's floor spacing is structural, not dependent on one group.
Question 2 · From the general manager"We want more playmaking. What does the market look like, and where do we stand?"
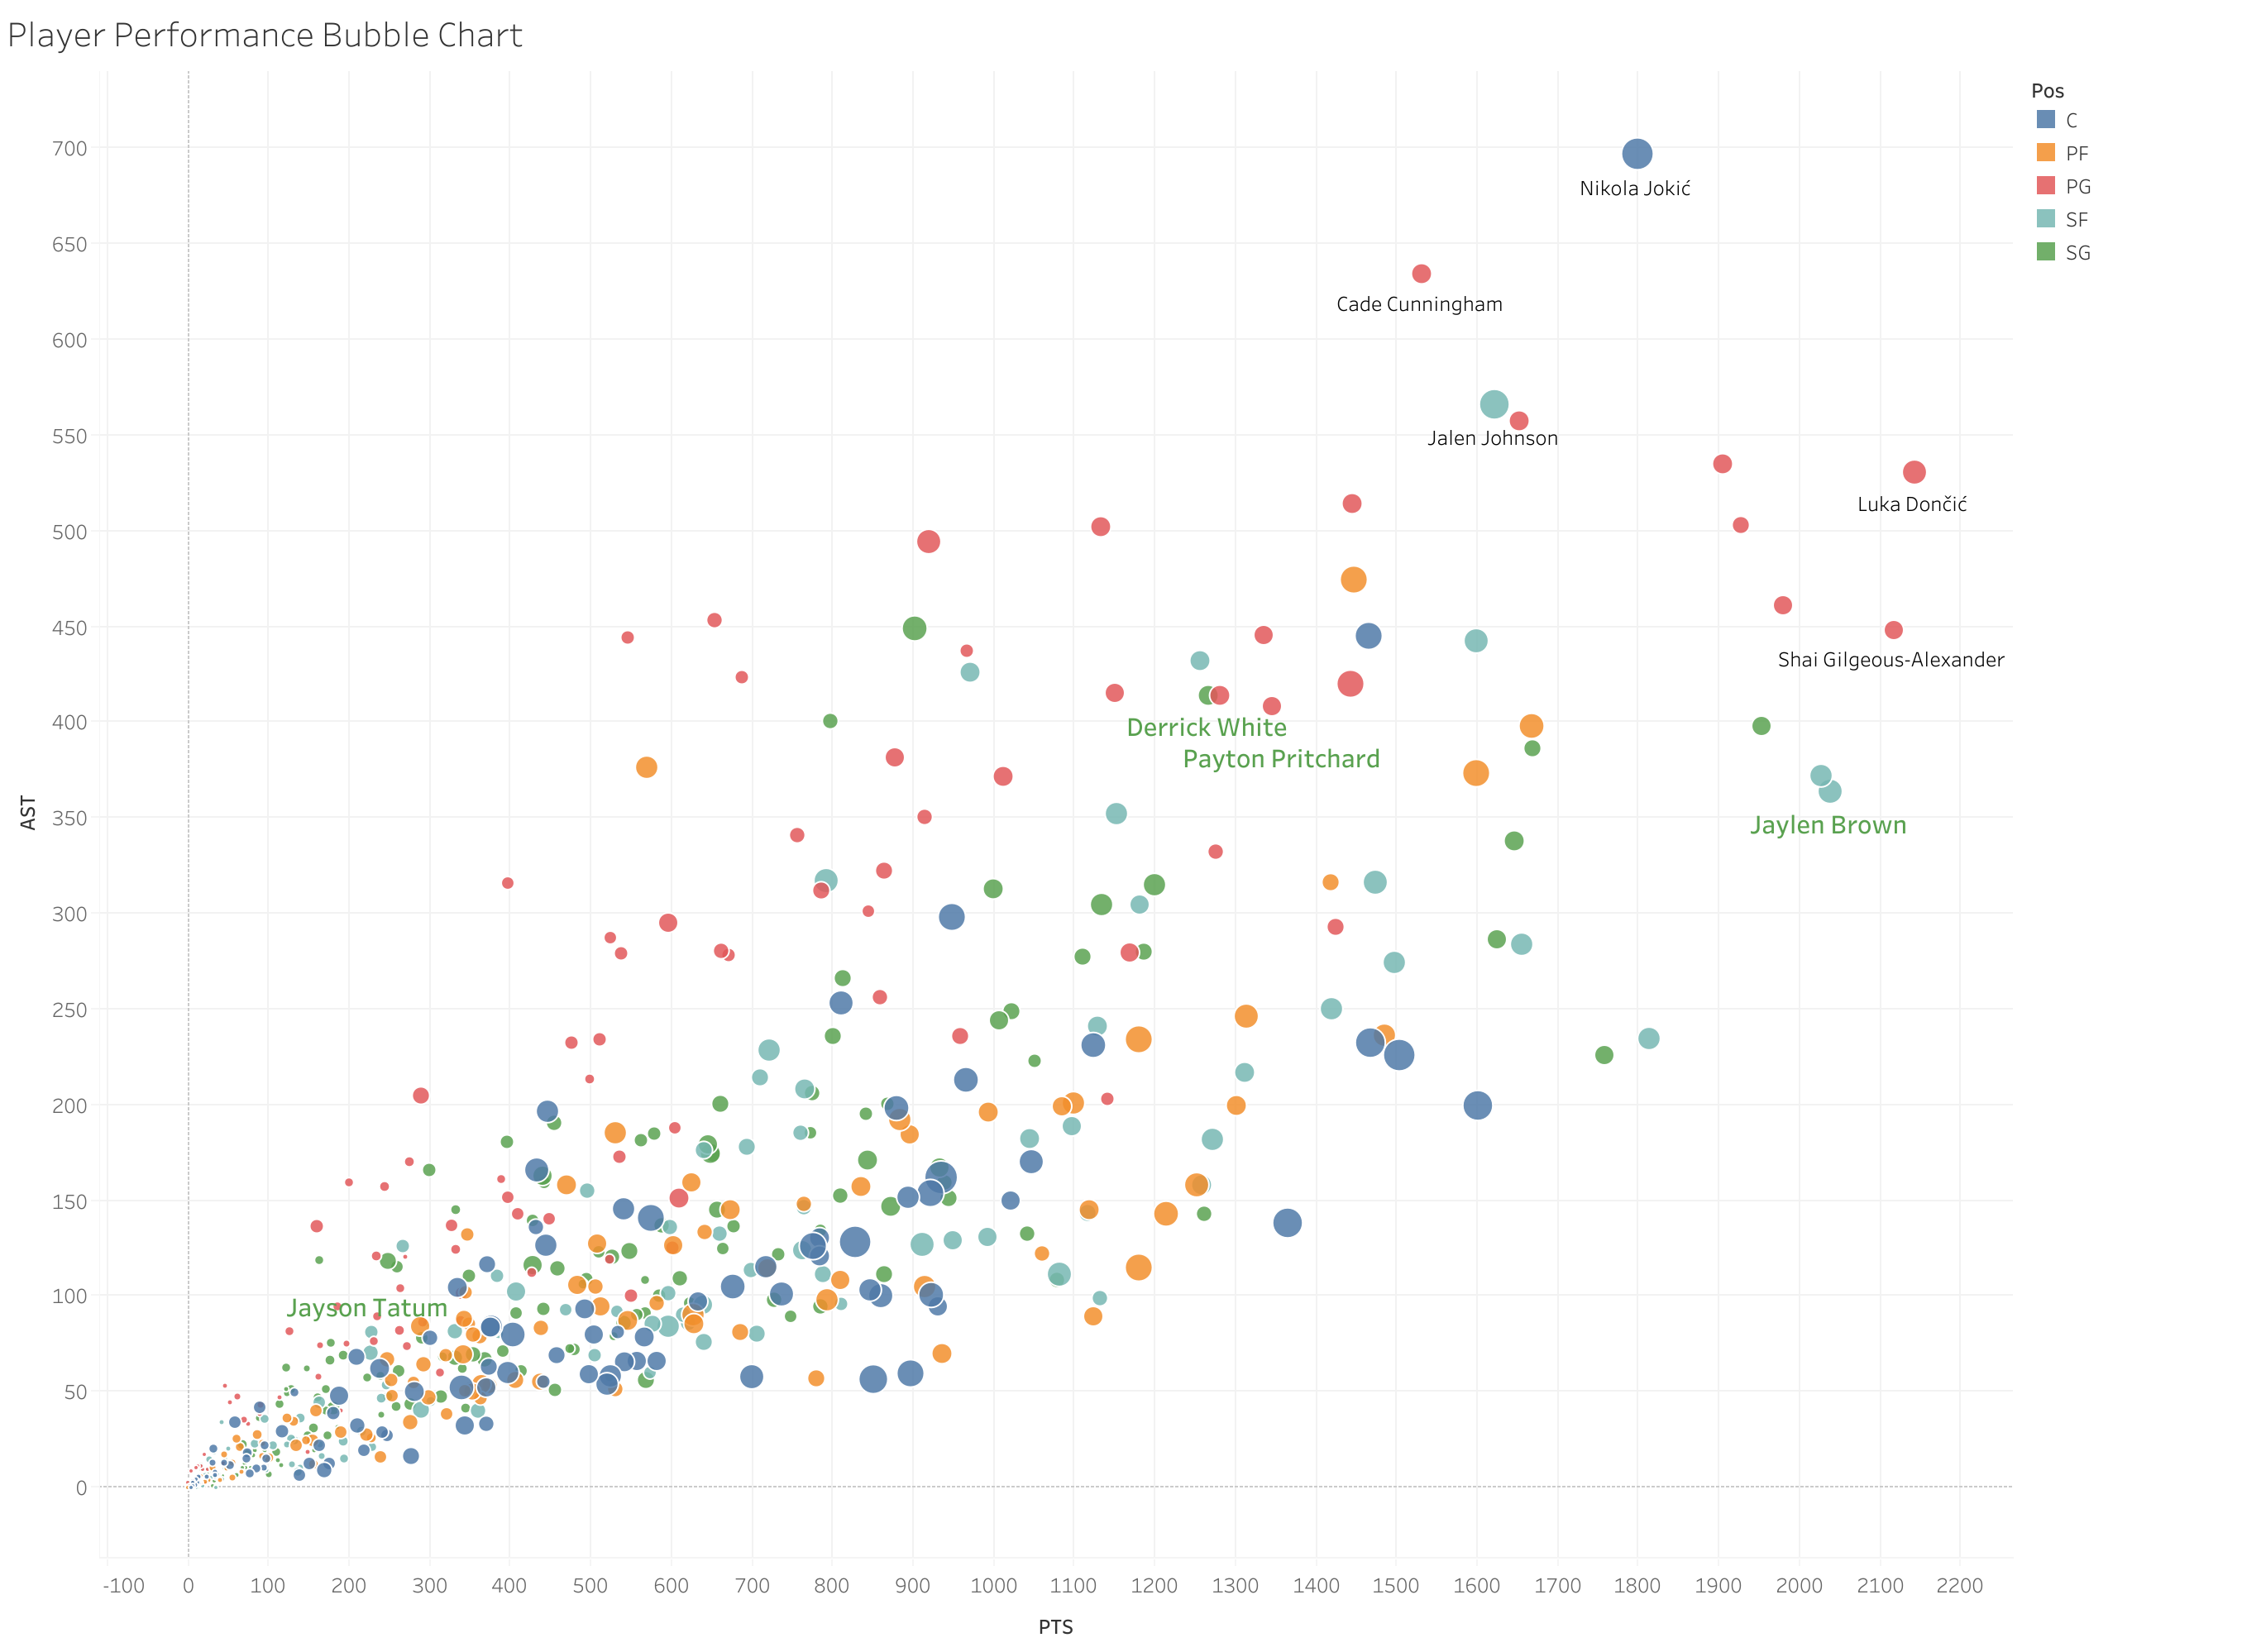
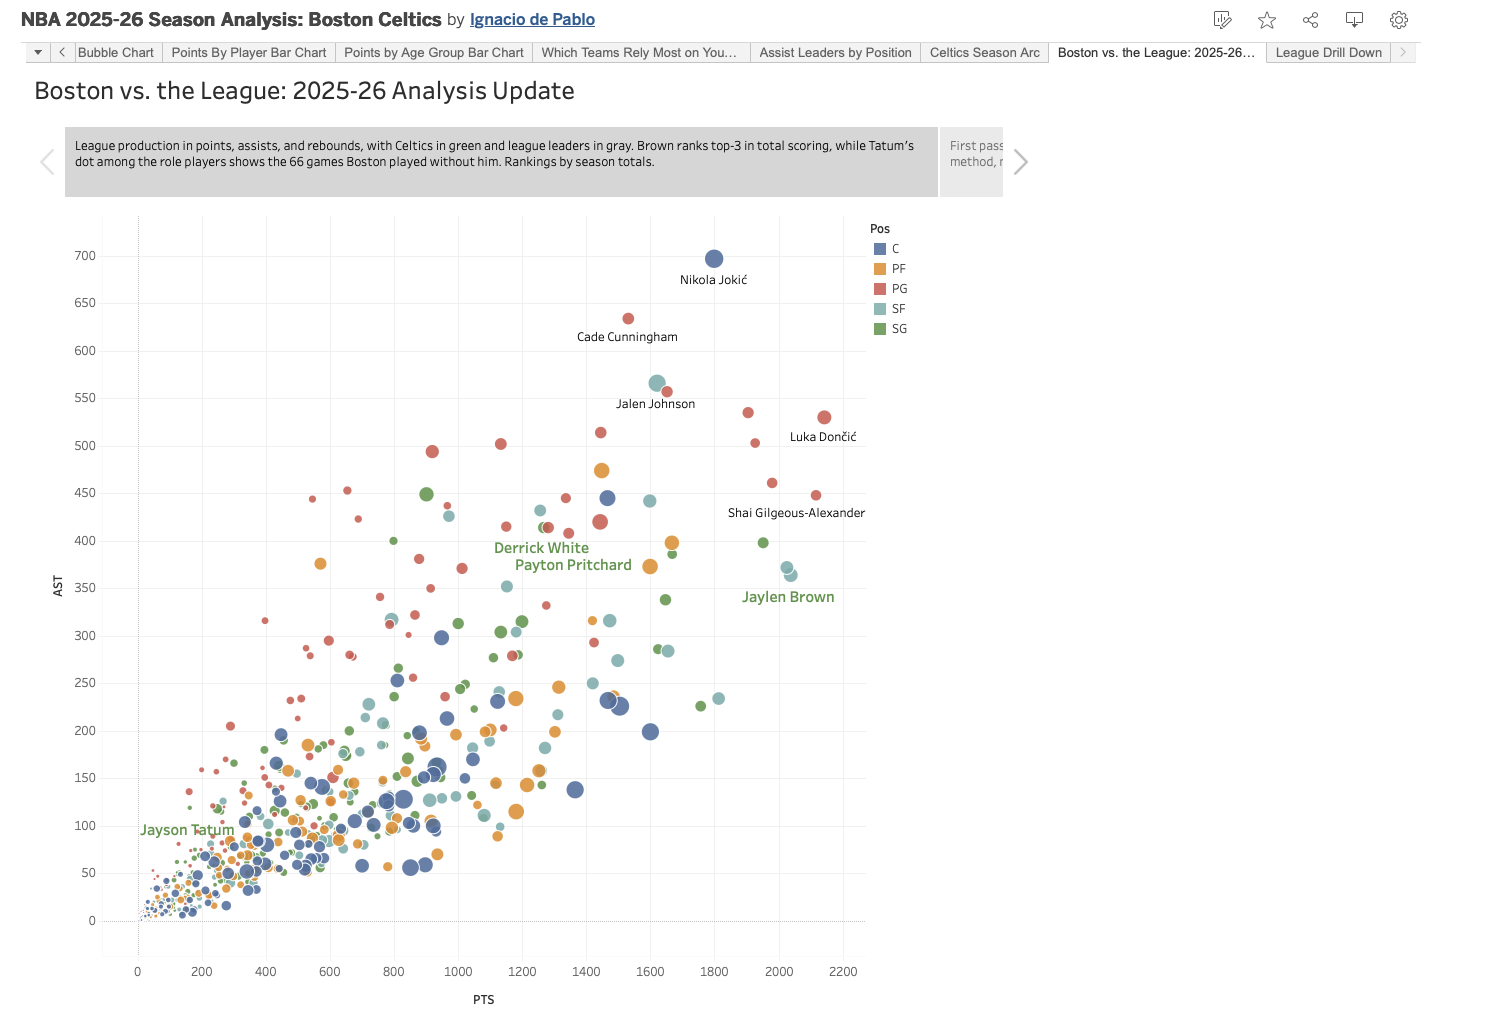
I mapped the assist market as a treemap grouped by position, then located Boston in it. The uncomfortable answer first: Derrick White led the team with 414 assists and Payton Pritchard was right behind at 408. The league's elite creators sit between 530 and 697. Boston runs its offense by committee, with four players sharing the load and nobody in the top tier.
The market itself had a surprise. Point guards dominate assist volume as a group, but the single biggest producer in the league is a center: Nikola Jokić with 697. The second lesson for a front office shopping for playmaking is that it no longer comes only in point guard form. Jalen Johnson produced 566 assists as a small forward. If Boston upgrades here, the market is wider than the obvious position.
Question 3 · From the front office"How is this roster aging? Where does the scoring come from in three years?"
I split every team's points into three age bands: under 25, 25 to 29, and 30 plus. Boston's profile is stark. Only 10% of the team's scoring came from players under 25, second lowest in the league behind New York. 75% came from the 25-29 prime band.
Read one way, that is exactly what a contender should look like: production concentrated in players at their peak. Read the other way, there is almost no internal pipeline. The teams at the opposite extreme (Washington at 77% under-25 scoring) are rebuilding, so youth share alone is not a virtue. But the gap between Boston's 10% and the league norm is the number I would put in front of the front office when the conversation turns to the next contract cycle.
Question 4 · From everyone in the building"How did we win 56 games without Jayson Tatum?"
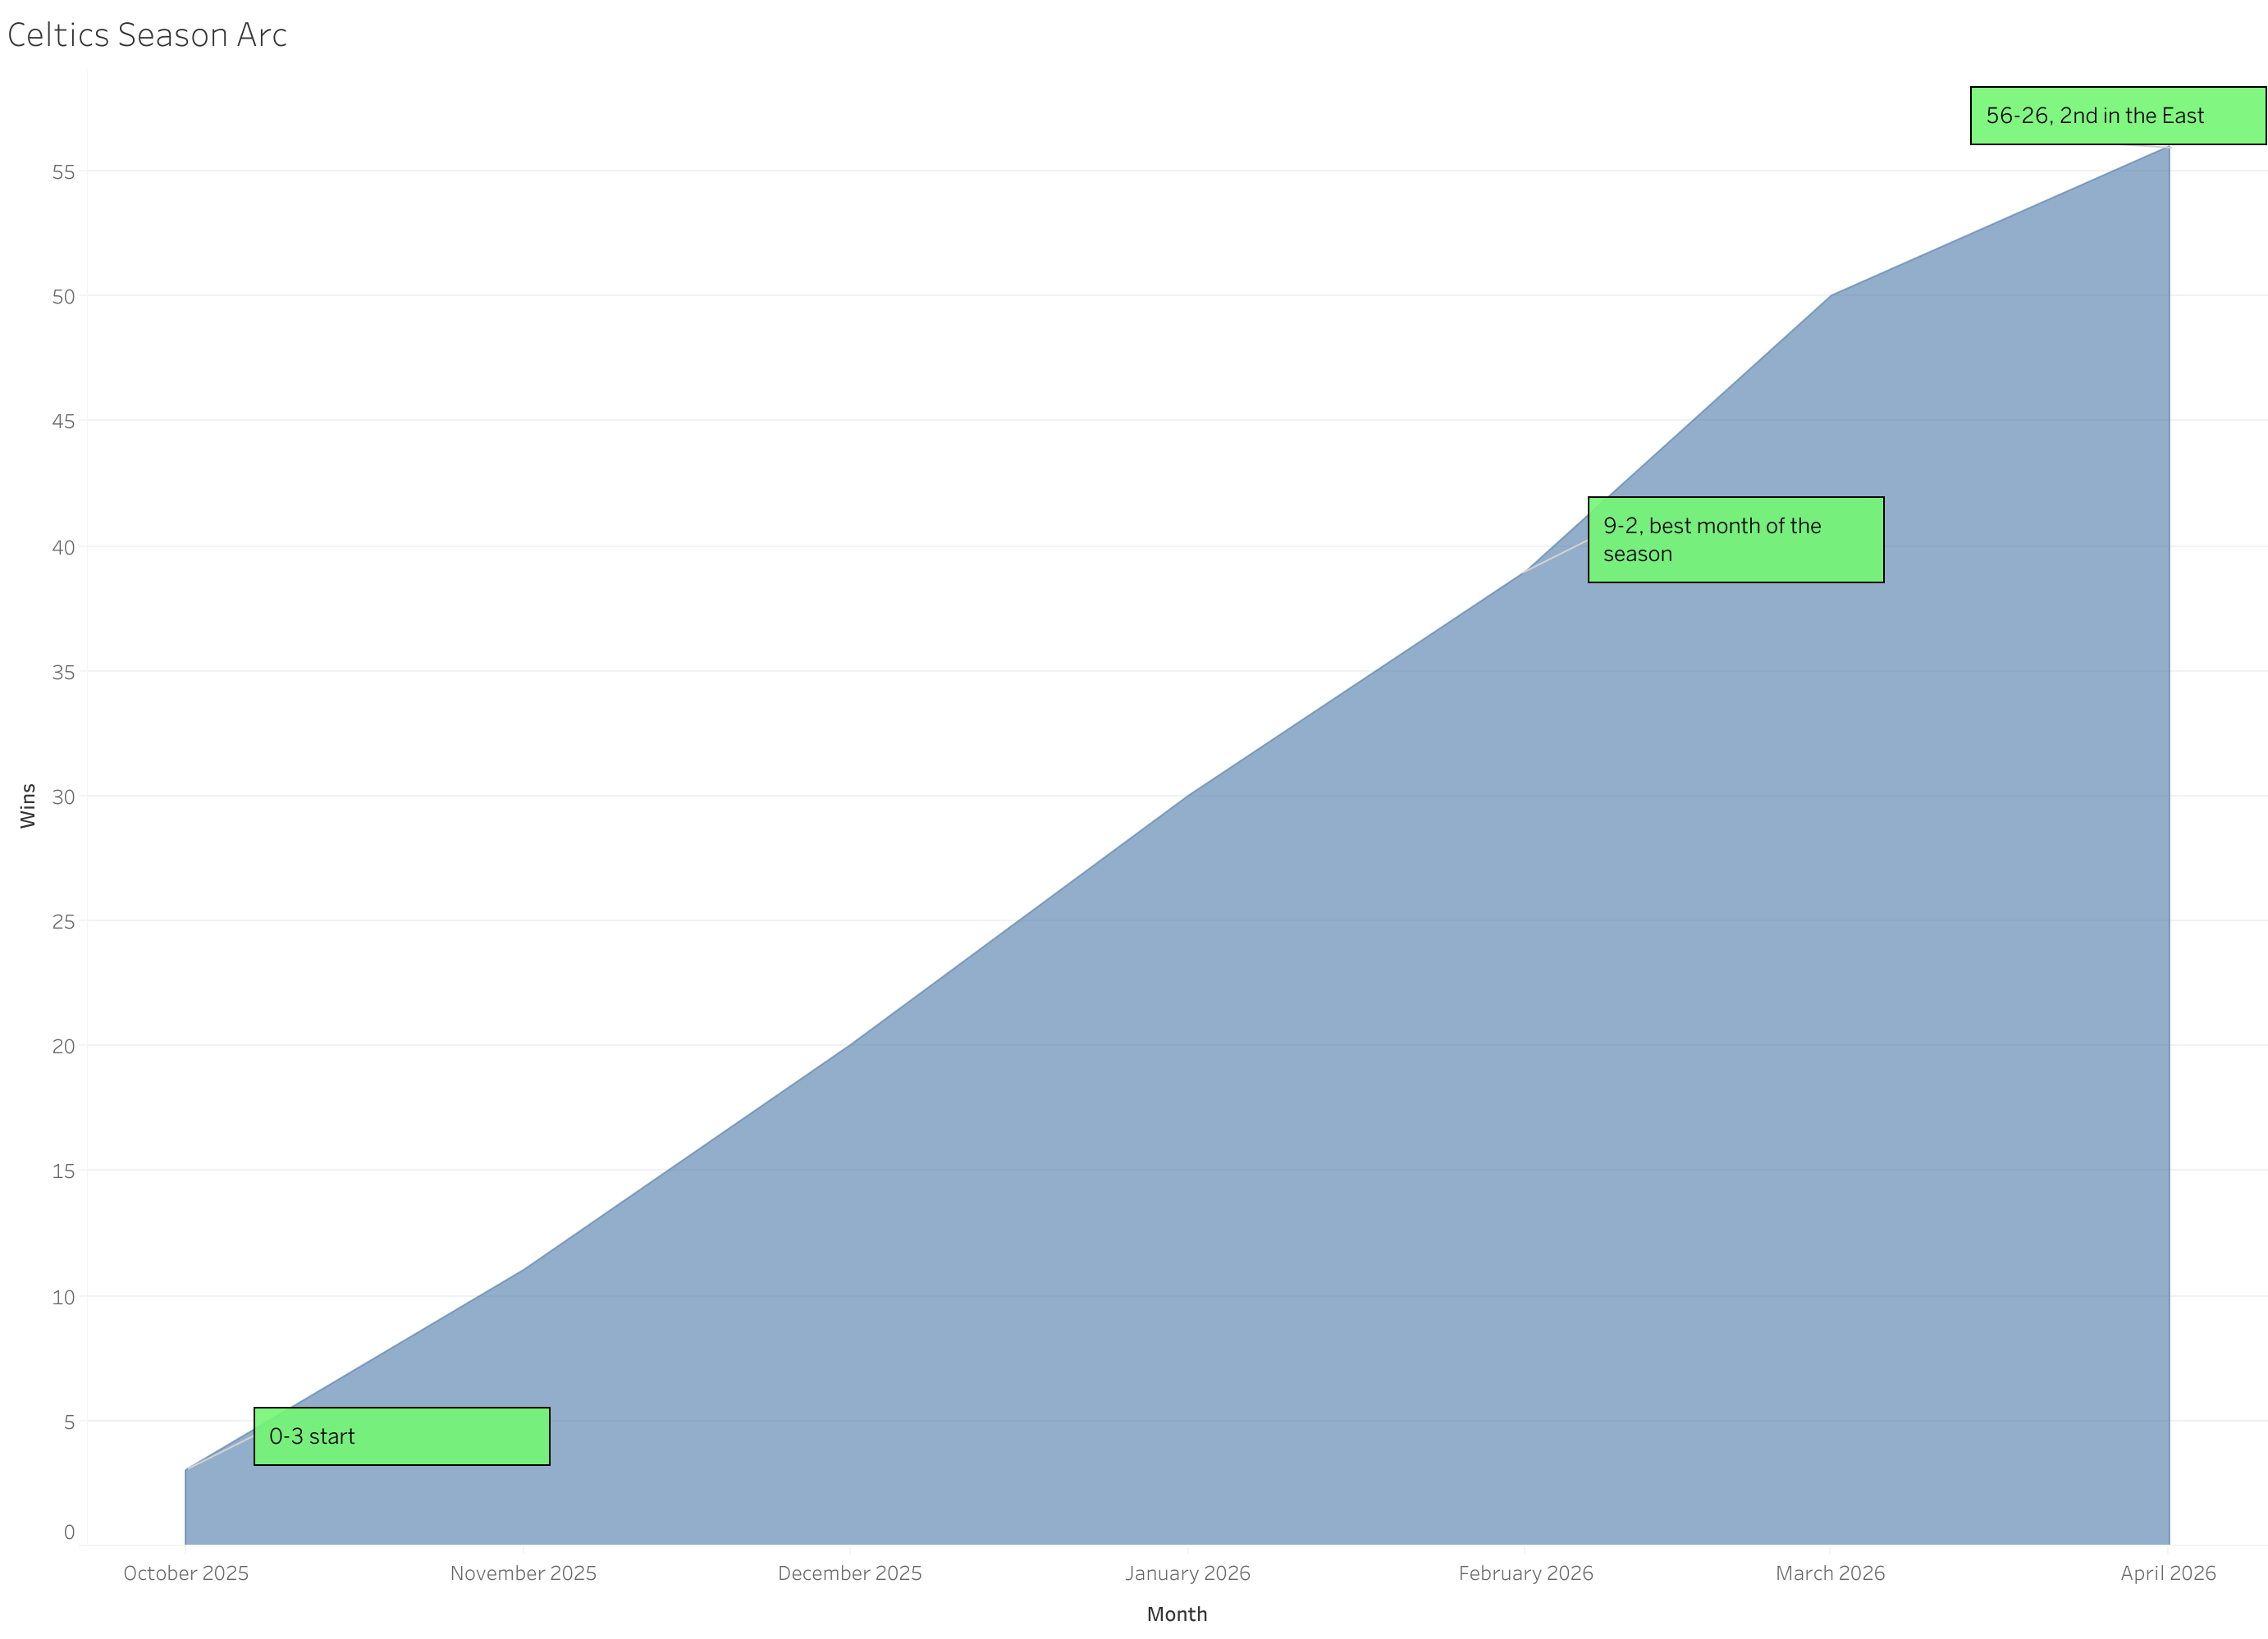
Tatum played only 16 regular season games, and averaged 21.8 points in them. The season happened mostly without him, and the game log tells the story: an 0-3 start, then a steady climb, a 9-2 February as the best month, and a 56-26 finish, second in the East.
The player data shows who carried it. Jaylen Brown finished top-3 in the league in total points. White and Pritchard combined for 822 assists and over 2,600 points. The bubble chart below is my favorite view of it: Celtics labeled in green against the league's leaders in gray, with Brown out among the elite and Tatum's dot sitting down among the role players, which is what 16 games of totals looks like.
One method note: rankings use regular season totals, which measure production plus availability. Per-game rankings differ slightly (Anthony Edwards edges Brown per game, 28.8 to 28.7), and I noted the basis on each chart so the two lenses never get confused.
Tools and takeaways
Built in Tableau Public with four related data sources, calculated fields for the traded-player cleanup, a drill-down hierarchy from conference to player, and a six-part story for presentation. Two habits I am keeping: verify a cleaning step is actually needed before applying it, and never trust an average of a ratio column.
Explore the interactive workbook
Explore the full interactive version on Tableau Public, including the drill-down to player level.
Data: Basketball-Reference / Sports Reference LLC. Validation: celtics.com official statistics.
Follow the work
Every project here is written up in full, and AZIMUTH ships in public with a phase-by-phase build log. Connect on LinkedIn to catch new posts, or reach out any time. Always happy to talk data.